
Master Your Domain
200+ programs across 6 cutting-edge technology domains
badge By Role
- AI Engineer
- Data Scientist
- Full Stack Developer
- VLSI Engineer
- EV Design Engineer
- Edge AI Specialist
- Embedded Firmware
- MLOps Architect
category By Domain
- psychology AI & Machine Learning
- analytics Data Science & Analytics
- code Software & Web Development
- memory Embedded Systems & IoT
- developer_board VLSI Design
- electric_car EV & Autonomous
workspace_premium By Skill
All Skills arrow_forwardIndustrial Internships 2026
80% practical · 8+ projects · Pantech - SVNIT dual cert
Hardware Lab Kits
200+ industry-grade lab kits
DIY Kits & Hardware Projects
Build, learn, and ship real projects with curated hardware kits
library_books Resources
Business Intelligence Power BI and Excel Analytics
Master Business Intelligence with Power BI and Excel Analytics. Learn data visualization, dashboards, reporting, DAX, Power Query, and business insights.
Business Intelligence Power BI and Excel Analytics
Comprehensive Syllabus Outline
A comprehensive curriculum designed to take you from beginner to professional.
Capstone Project
HR Data Analytics Dashboard
Clean and model workforce data in Power Query, build measures and relationships, and deliver an interactive Power BI dashboard backed by Excel pivot analysis.
Tech Stack
Master the primary professional software development packages and workflow tools.
After this Course, You will be Able to
Observe the real-world utility outcomes you gain after program completion.
Course Stats
₹12.35 LPA
Average Salary₹42 LPA
Highest Salary135%
Salary Hike7+ Companies
Hiring PartnersKey Features
Mentorship
Receive guidance and insights from industry expertsHands-on Experience
Gain practical skills in a real-world cutting-edge projects.Networking
Connect with professionals and peers in your fieldSkill Development
Enhance your technical and soft skillsCareer Advancement
Boost your resume with valuable experienceDual Certificate
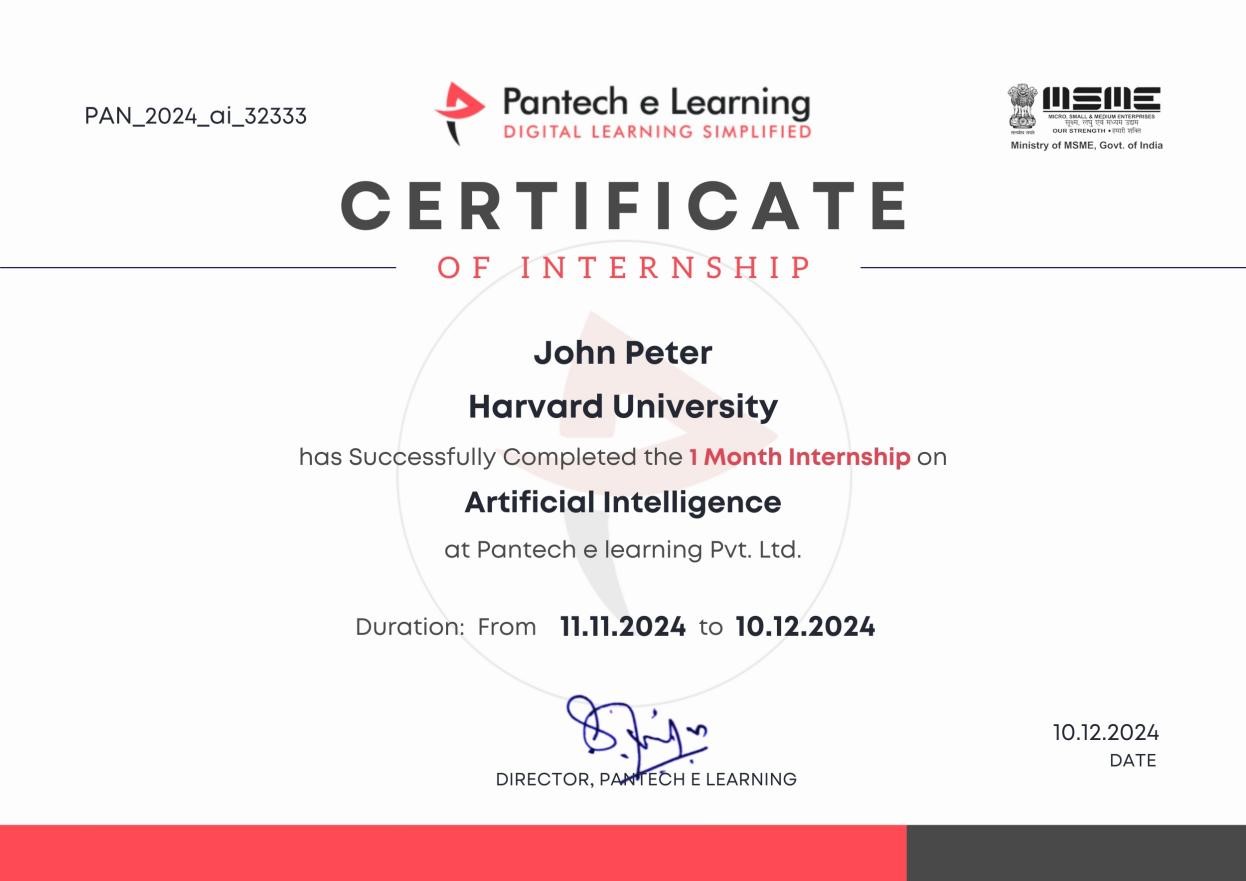
Get a certification to showcase your achievementsLet Your Certificates Speak For You
Our certification formally validates your skill set in recruiter searches with unique QR code verification and LinkedIn-ready structures.
Unique Credential ID & QR Code
Recruiters can scan to instantly verify your project files, source repository, and official completion marks.
Linkedin Certified Recognition
Easily push to your Linkedin profile with 1-click credential linking to increase high-end corporate recruiter views.
Where Our Learners Work
Our alumni are driving innovation at the world's most prestigious technology companies.


Why Pantech?
An expert-crafted learning infrastructure built for technical fluency.
Industrial Expert Mentors
Direct guidance and weekly doubt clearing sessions hosted by hardware, embedded, and software engineering veterans.
24/7 Interactive Support
Ask coding doubts anytime on our student community workspace and receive instant assistance.
Self-Paced Learning Engine
Access lifetime recorded modules with adaptive pacing to balance academics and professional work.
Career Guidance Support
Exclusive resume review, mock interviews, and placement assistance from industry experts.
We are Accredited by


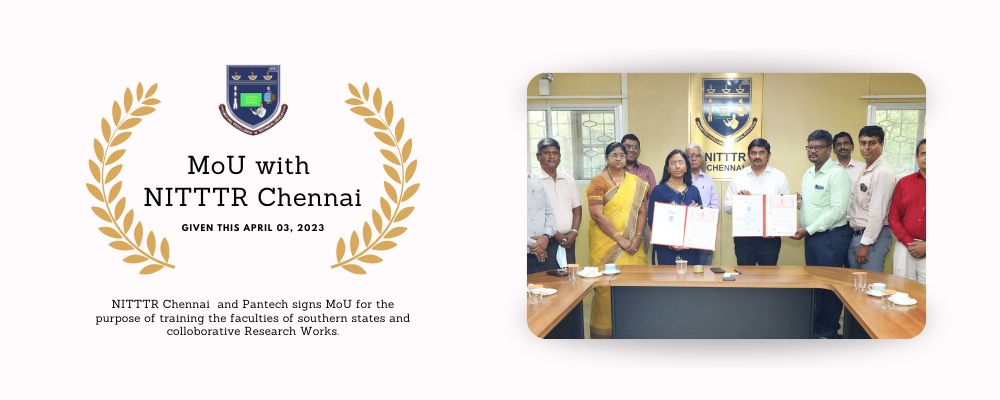


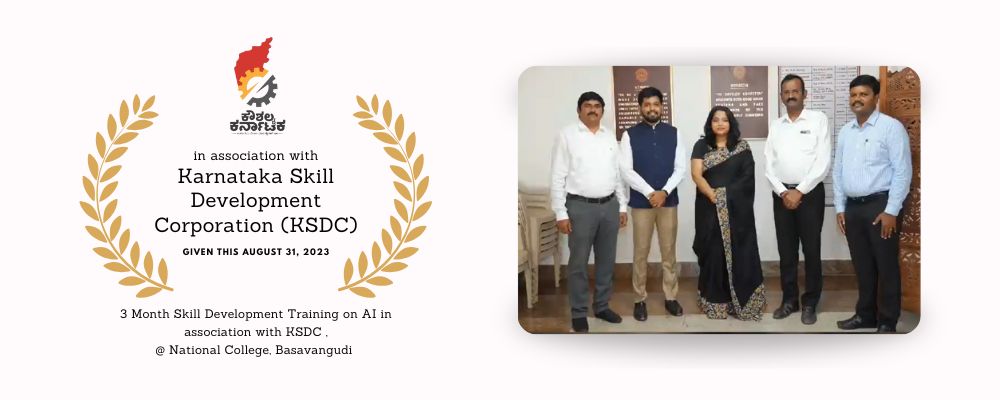
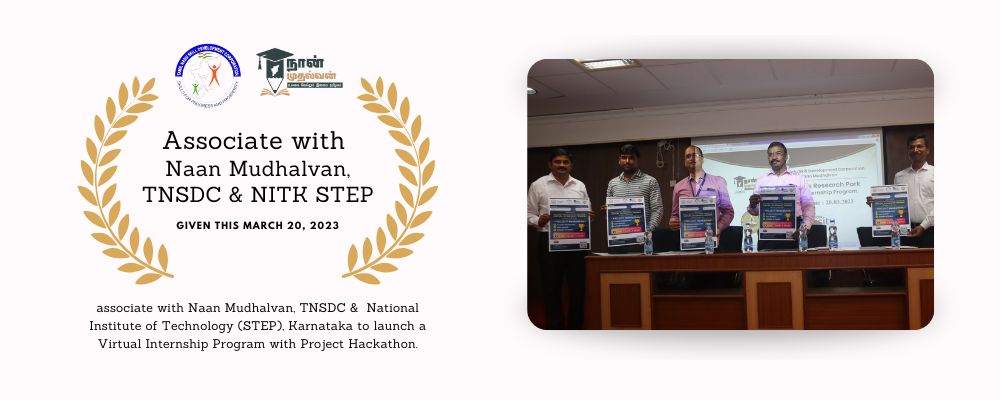



What Our Students Say
See how Pantech courses accelerated career transitions across India.
Student Pantech
VERIFIED LEARNERStudent Pantech
VERIFIED LEARNERGet exclusive lifetime access to coursework, simulators, custom templates, and direct placement opportunities.
Need immediate counseling?
+91 8925533488/89
Frequently Asked Questions
Find instant answers to all common questions about our technical certificate courses.
No. The course begins with Power BI fundamentals and gradually progresses to advanced dashboard development and analytics projects.
Yes. A significant portion of the curriculum focuses on Excel analytics, Pivot Tables, statistical analysis, and business reporting techniques.
Yes. The course includes practical projects such as an HR Analytics Dashboard along with salary and stock market case studies.
You will learn dashboard development, data visualization, data modeling, query management, business reporting, and analytical decision-making.
The course covers Microsoft Power BI, Power Query, DAX fundamentals, Microsoft Excel, Pivot Tables, Pivot Charts, and business intelligence visualization techniques.
Absolutely. It provides a strong foundation for careers in Data Analytics, Business Intelligence, Reporting, and Dashboard Development.
Related Courses
Enhance your skills with these recommended courses carefully selected for your learning journey.

